Ever wondered where hidden inefficiencies lurk within your data and digital ecosystem.
Introducing the DELTA Efficiency Tool, your compass for navigating the intricacies of your business ecosystem.
🔍 𝑾𝒉𝒂𝒕 𝒊𝒔 𝑫𝑬𝑳𝑻𝑨 𝑬𝒇𝒇𝒊𝒄𝒊𝒆𝒏𝒄𝒚 𝑻𝒐𝒐𝒍?
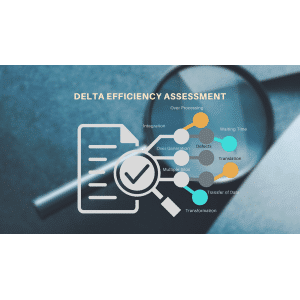
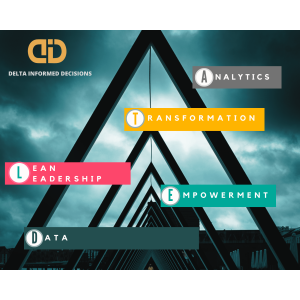
DELTA, short for 𝑫𝒂𝒕𝒂, 𝑬𝒎𝒑𝒐𝒘𝒆𝒓𝒎𝒆𝒏𝒕, 𝑳𝒆𝒂𝒓𝒏𝒊𝒏𝒈 𝒂𝒏𝒅 𝑳𝒆𝒂𝒏, 𝑻𝒓𝒂𝒏𝒔𝒑𝒂𝒓𝒆𝒏𝒄𝒚, 𝒂𝒏𝒅 𝑨𝒏𝒂𝒍𝒚𝒕𝒊𝒄𝒔, goes beyond the surface. It’s a comprehensive evaluation tool designed to uncover inefficiencies across 𝑻𝒓𝒂𝒏𝒔𝒍𝒂𝒕𝒊𝒐𝒏 𝒐𝒇 𝒃𝒖𝒔𝒊𝒏𝒆𝒔𝒔 𝒎𝒆𝒕𝒓𝒊𝒄𝒔, 𝑫𝒂𝒕𝒂 𝑻𝒓𝒂𝒏𝒔𝒇𝒆𝒓, 𝑰𝒏𝒕𝒆𝒈𝒓𝒂𝒕𝒊𝒐𝒏, 𝑴𝒖𝒍𝒕𝒊𝒑𝒍𝒆 𝑺𝒊𝒍𝒐𝒔, 𝑾𝒂𝒊𝒕𝒊𝒏𝒈 𝒕𝒊𝒎𝒆, 𝑶𝒗𝒆𝒓 𝑷𝒓𝒐𝒄𝒆𝒔𝒔𝒊𝒏𝒈, 𝑶𝒗𝒆𝒓 𝑮𝒆𝒏𝒆𝒓𝒂𝒕𝒊𝒐𝒏, 𝒂𝒏𝒅 𝑫𝒆𝒇𝒆𝒄𝒕𝒔.
𝑾𝒉𝒚 𝑫𝒐𝒆𝒔 𝒊𝒕 𝑴𝒂𝒕𝒕𝒆𝒓?
Efficiency is the heartbeat of success. DELTA helps you pinpoint areas where improvements can make a substantial impact on your bottom line. From streamlined processes to cost savings, we’ve got your journey to excellence covered.
You can’t simply double the oven temperature to halve the baking time. And, while you can cover up a burnt crust with some icing, it won't get rid of that bitter taste.
What you need are quality ingredients, reliable tools – and a proven process to follow.
In other words, you need a range of disparate elements – all working together to create something that’s more valuable (and tastes better!) than the sum of its parts.
You can’t simply throw more data analysts into the mix. Nor can you rely on dashboards that look pretty – but offer little practical value – to dictate your strategy.
You need a proven framework that’s been refined and designed for success.
Wouldn’t it be nice if you could fix issues and boost productivity with the wave of a wand?
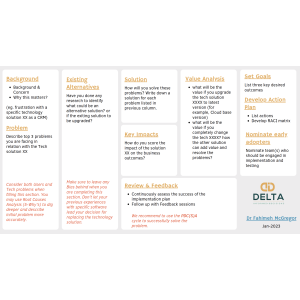
When applying a problem-solving framework, consider customizing the Lean Problem Solving canvas to align with the unique aspects of your business. Ensure comprehensive coverage by incorporating key areas such as Background, Problem Definition, Existing Alternatives, Solution Design, Key Impacts, Value Analysis, Goal Setting, Action Plan Development, Early Adopter Nomination, and Regular Review and Feedback.
How to best utilize Problem Solving Canvas?
To enhance the effectiveness of the tool, integrate complementary methodologies like 5-Why’s, PDCA (Plan-Do-Check-Act), Root Cause Analysis, and RACI (Responsible-Accountable-Consulted-Informed).
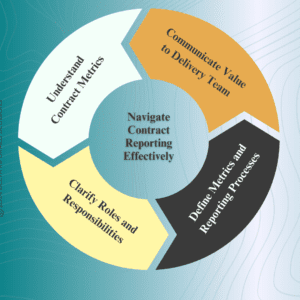
Navigating Contract Reporting
Signing a new contract is an exciting milestone, but effectively reporting to stakeholders requires careful planning and execution. Let’s explore some essential steps to ensure smooth contract management and reporting.
⚠️ Risk: Underreporting the Contract
Underreporting the contract can have significant financial implications. Ensure accurate and timely reporting to provide stakeholders with the insights they need to make informed decisions.
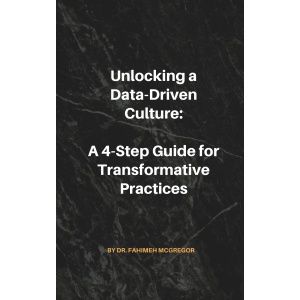
Data-Driven Leadership Navigator: A Simple 4-Step Guide for Transformative Practices
Unlock the full potential of your organization’s data with the Data-Driven Leadership Compass from DELTA. Designed as your guide to navigating the complexities of modern business intelligence, to drive strategic decision-making and organizational success.
Navigating the complexities of data shouldn't be daunting.
That’s why we’ve crafted this simple yet powerful guide to empower your mission for excellence.
Download the Data-Driven Leadership Compass today and empower your organization to unlock the full potential of its data. With this powerful tool at your fingertips, navigate the complexities of modern business intelligence with confidence and drive sustainable growth and success.
Are data products (like reports and dashboards) fueling your growth and driving your business? Or are they failing to gain traction?
If it’s the latter, that doesn’t necessarily mean that your dashboard is poorly designed. Or that you need to invest in (even more) cutting-edge technology.
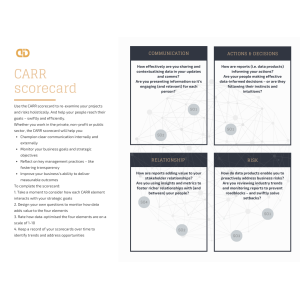
Let’s review your culture and projects holistically. It’s why I developed the CARR scorecard to help you re-examine how you think about processes and risks. So you can drive measurable outcomes in your business.
Use the scorecard to listen to the voice of data in your organisation. To make data-informed decisions, manage risks *proactively* and foster richer relationships.
Why? 𝐏𝐫𝐨𝐦𝐨𝐭𝐢𝐧𝐠 𝐭𝐫𝐚𝐧𝐬𝐩𝐚𝐫𝐞𝐧𝐜𝐲 𝐡𝐞𝐥𝐩𝐬 𝐲𝐨𝐮𝐫 𝐩𝐞𝐨𝐩𝐥𝐞 𝐭𝐨 𝐛𝐞 𝐦𝐨𝐫𝐞 𝐩𝐫𝐞𝐩𝐚𝐫𝐞𝐝 𝐭𝐨 𝐚𝐝𝐨𝐩𝐭 𝐚 𝐝𝐚𝐭𝐚-𝐝𝐫𝐢𝐯𝐞𝐧 𝐜𝐮𝐥𝐭𝐮𝐫𝐞.
Because you can’t achieve business intelligence by *only* focusing on technical aspects. (Like installing more software solutions or hiring more data analysts.) Instead, 𝐲𝐨𝐮 𝐧𝐞𝐞𝐝 𝐭𝐨 𝐧𝐮𝐫𝐭𝐮𝐫𝐞 𝐭𝐡𝐞 𝐫𝐢𝐠𝐡𝐭 𝐜𝐮𝐥𝐭𝐮𝐫𝐞. Which takes time and effort.
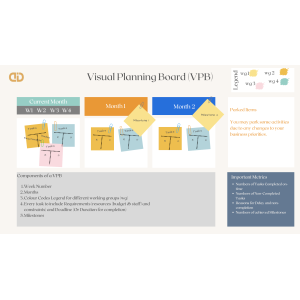
Plans are good. But visual planning boards – and the transparency they enable – are better.
𝑻𝒉𝒂𝒏𝒌𝒇𝒖𝒍𝒍𝒚, 𝒘𝒆 𝒄𝒂𝒏 𝒖𝒔𝒆 𝒕𝒐𝒐𝒍𝒔 𝒍𝒊𝒌𝒆 𝒗𝒊𝒔𝒖𝒂𝒍 𝒑𝒍𝒂𝒏𝒏𝒊𝒏𝒈 𝒃𝒐𝒂𝒓𝒅𝒔 𝒕𝒐 𝒆𝒏𝒉𝒂𝒏𝒄𝒆 𝒕𝒓𝒂𝒏𝒔𝒑𝒂𝒓𝒆𝒏𝒄𝒚, 𝒍𝒆𝒂𝒅𝒆𝒓𝒔𝒉𝒊𝒑 𝒂𝒏𝒅 𝒂𝒏𝒂𝒍𝒚𝒕𝒊𝒄𝒂𝒍 𝒕𝒉𝒊𝒏𝒌𝒊𝒏𝒈. 𝑨𝒍𝒍 𝒂𝒕 𝒐𝒏𝒄𝒆.



 Margarita Gonzalez-Borrero


